CountBio
Mathematical tools for natural sciences
Biostatistics with R
3D scatter plots
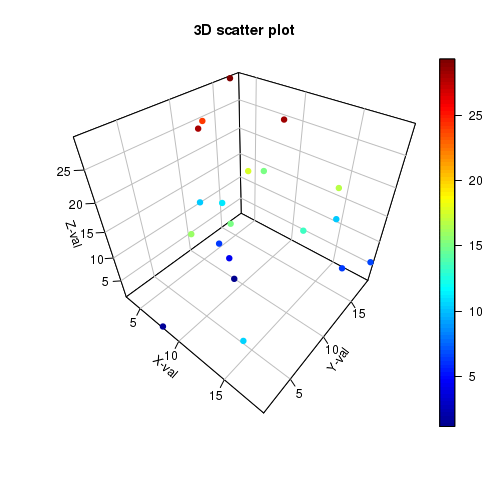
A three dimensional scatter plot shows points P(x,y,z) in three dimensiona space. The
The properties of the 3D scatter plot can be altered using some of the arguments to
 x,y,z  ------> vectors with values along three axes

 theta, phi  -----> the azimuthal and colattitude directions for viewing. Angles in degrees.

 box -----> To draw a box with axes. A value of TRUE draws a box. Default is TRUE.

 bty -----> Type of box to be drawn. Wroks when BOX=TRUE. Three types of                           boxes for 3 options bty = "g", "b2","bl"

 axes -----> Boolean value of TRUE draws the axes.

 label -----> A value of TRUE enables the label for axes.

 nticks -----> An integer specifying the number of ticks on the 3 axes.

For other parameters of this function, type  help(scatter3D) in R prompt.
library(plot3D)

# number of data points.
npoints = 20

# generate sequences for X,Y values
x = runif(npoints,1,20)
y = runif(npoints,1,20)

# generate random numbers between (0,30) for Z values
z = 30*runif(npoints)

# Call to scatter3D function
scatter3D(x,y,z,box=TRUE,pch=16,bty="b2",axes=TRUE,label=TRUE, nticks=5, ticktype="detailed",theta=40, phi=40, xlab="X-val", ylab="Y-val", zlab="Z-val", main="3D scatter plot")
The resulting scatter plot is shown below:
