CountBio
Mathematical tools for natural sciences
Biostatistics with R
Box and whisker plots
The Box and Whisker plot is used to graphically represent the spread in the data by showing the quartiles of the data along with the extreme values.
Given a data set, we can arrange the numbers in ascending order to compute the following statistical parameters:
 minimum value  of the data.

 First Quartile (Q1) is the value below which one fourth of the data points lie.

 Median value or Second Quartile (Q2) is the value below which half of the data points lie.

 Third Quartile (Q3)  is the value below which three fourth of the data points are located.

 Maximum value  of the data set.

 Inter quartile range = (Q3-Q1)  is the difference between first and third quartiles.

 Ourliers in the data  :  The definition of outlier in the data is a bit arbitrary.

                             To decide the outlier, first compute the above mentioned parameters
                             using whole data set.

                             For an arbitrary number 'm', declare the data points m*(Q3-Q1)
                             above Q3 or m*(Q3-Q1) below Q1 as outliers.
A box and whisker plot is made up of a box at the center with three quartiles marked on it. From the end of the box, two whiskers are extended along both sides to touch the maximum and minimum points in the data. The outliers are also marked as points above and below the whiskers, if needed.
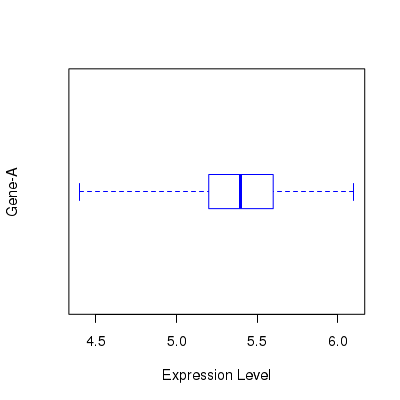
Suppose, for a given data set we compute the parameters as follows:
min = 4.4, Q1=5.2, median=5.4, Q3=5.6, max=6.1
The Box and whisker plot for this data is shown here:

In R, we can create Box and whisker plots using the function boxplot() . The code below creates the data vector and passes it to the function:
data = c(5.3,6.1,4.9,5.5,4.4,4.9,6.0,5.7,5.1,5.6,5.4,5.3,5.8,5.4,5.2,5.5,5.4)

boxplot(x = data, range=0.0, horizontal=TRUE, varwidth=FALSE, notch=FALSE,
        outline=TRUE, boxwex=0.3, border=c("blue"), xlab="Expression Level", ylab="Gene-A")
The above script line create the following plot:
The important parameters of the boxplot() function
x ---->  Data in the form of a numeric vector, a list of vectors or a data frame.

range ---->  A number that decides the data values  upto which the
              whiskers extend. A value of zero makes the whiskers extend upto extreme data point on
              both sides.A positive value m extents the whiskers upto m times the interquartile distance
              on both sides.  Points outside this range are marked as outliers .


width ----> a vector giving the relative widths of the boxes making up the plot.

varwidth ---->  A logical value that decides whether the width of the box is
               related to the data size.
               If varwidth=TRUE, the box width will be proportional to the  square root of
                the number of observations in the data.
               If varwidth=FALSE, width of the box will not be dependent on data size.

notch ----> If notch is TRUE, a notch is drawn  on each side of the boxes.

outline ----> This controls the display of outliers.
               If outline=FALSE, outliers are not drawn.
               If outline=TRUE, outliers are drawn as points.

names ----> A vector of strings to be printed as names under each box.


horizontal ----> A logical value that decides whether the box and whiskers are drawn horizontally or vertically.

                   horixontal=TRUE creates horizontal boxes
                   horizontal=FALSE creates vertical boxes.

color ----> color to fill the bodies of the boxes.
             By default, inside of the boxes will be painted with background color.


na.action ----> A function which indicates the action to be taken when the data has NA's.

              By default, missing values are ignored in the plot.


For a comprehensive list of all commands, type  help(boxplot) in R prompt.
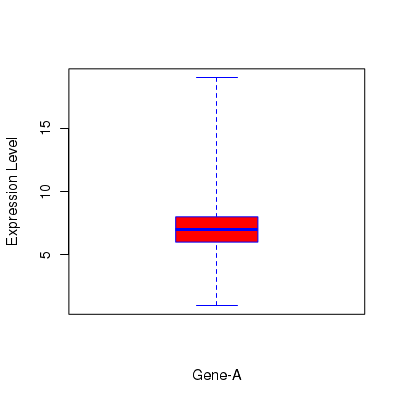
A simple Box and Whisker plot in vertical direction
Using the function boxplot(), the following code generates a vertical box plot filled with red color. The parameter value range=0.0 makes whiskers extend upto extreme values in the data set:
# Generate a data vector
x <- c(1,5,7,8,9,7,5,1,8,5,6,7,8,9,8,6,7,8,10,19,6,7,8,6,4,6)

# We call boxplot with single vector.  range=0.0 causes the whiskers to extend upto extreme points.

boxplot(x, range=0.0, horizontal=FALSE, varwidth=TRUE, notch=FALSE,
 outline=TRUE, boxwex=0.3, border=c("blue"), col=c("red"), xlab="Gene-A", ylab="Expression Level")
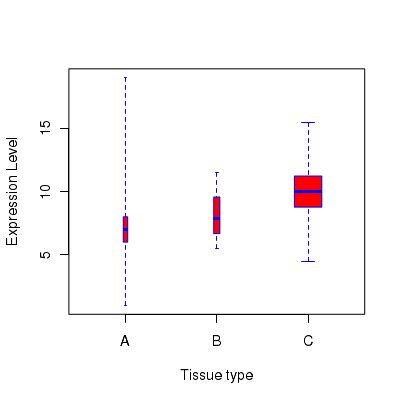
Box Whisker plot for multiple data sets
If we have a group of data sets with different sizes, we can create a box plot whose width varies with the size of the data set. In the example below, we create 3 data sets x,y and z with 26, 50 and 1000 data points respectively. We call the boxplot() function with a parameter value varwidth=TRUE. This gives a plot in which the box widths ofeach data set is proportional to the square root of the number of data points in the set:
# Generate three vectors
x <- c(1,5,7,8,9,7,5,1,8,5,6,7,8,9,8,6,7,8,10,19,6,7,8,6,4,6)
y = rnorm(50, mean=8, sd=2)
z = rnorm(1000, mean=10, sd=1.8)

# we create a list of vectors and call box plot with it.
# range=0.0 causes the whiskers to extend upto extreme points.
# varwidth=TRUE sets the box width proportional to the number of data points.

# Three Box-Whiskers are plotted for x, y and x vectors
alis <- list(x,y,z)

boxplot(alis, range=0.0, horizontal=FALSE, varwidth=TRUE, notch=FALSE,
        outline=TRUE, names=c("A","B","C"), boxwex=0.3,
        border=c("blue","blue","blue"), col=c("red","red","red"),
        xlab = "Tissue type", ylab = "Expression Level")
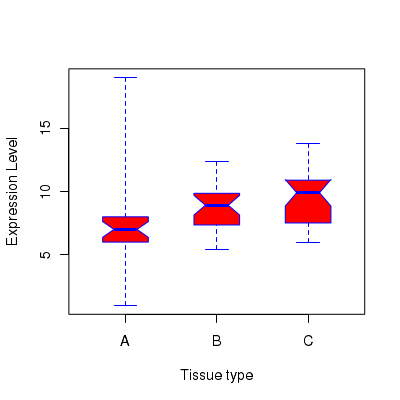
Box and Whisker plot with notches
Notches can be added to the box plot using the parameter value notch=TRUE . See the example code and the plots below:
x <- c(1,5,7,8,9,7,5,1,8,5,6,7,8,9,8,6,7,8,10,19,6,7,8,6,4,6)
y = rnorm(26, mean=8, sd=2)
z = rnorm(26, mean=10, sd=1.8)

aframe <- data.frame(x,y,z)

#range=0.0 causes the whiskers to extend upto extreme points.
boxplot(aframe, range=0.0, horizontal=FALSE, varwidth=FALSE, notch=TRUE,
        outline=TRUE, names=c("A","B","C"), boxwex=0.5,
        border=c("blue","blue","blue"), col=c("red","red","red"),
        xlab = "Tissue type", ylab = "Expression Level")
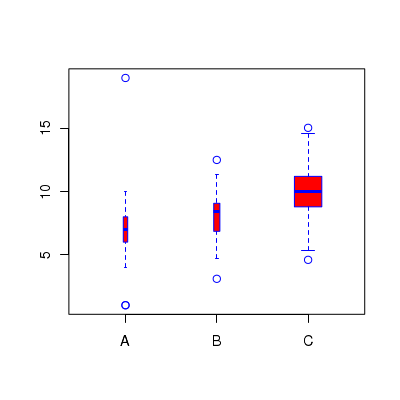
Box plot with outliers marked
Using the parameter range , we can identify the outliers in the data and plot them. For a numerical value range=m , all data points with values m*(Q3-Q1) above Q3 or m*(Q3-Q1) below Q1 are sonsidered to to be outliers, and are marked in the plot as points. See below:
x <- c(1,5,7,8,9,7,5,1,8,5,6,7,8,9,8,6,7,8,10,19,6,7,8,6,4,6)
y = rnorm(50, mean=8, sd=2)
z = rnorm(1000, mean=10, sd=1.8)

aframe <- list(x,y,z)

# We call boxplot with single vector
boxplot(aframe, horizontal=FALSE, varwidth=TRUE, notch=FALSE, range=1.5,
 outline=TRUE, names=c("A","B","C"), boxwex=0.3, border=c("blue"), col=c("red"))