CountBio
Mathematical tools for natural sciences
Biostatistics with R
Multiple curves on the same plot
To plot more than one curve on a single plot in R, we proceed as follows. Create the first plot using the
In the R script shown below, we plot the curves of three data sets (x,y1),(x,y2) and (x,y3) on the same plot. The code and the plot are shown here:
# define 3 data sets
 xdata <- c(1,2,3,4,5,6,7)
 y1 <- c(1,4,9,16,25,36,49)
 y2 <- c(1, 5, 12, 21, 34, 51, 72)
 y3 <- c(1, 6, 14, 28, 47, 73, 106 )

# plot the first curve by calling plot() function
# First curve is plotted
 plot(xdata, y1, type="o", col="blue", pch="o", lty=1, ylim=c(0,110) )

# Add second curve to the same plot by calling points() and lines()
# Use symbol '*' for points.
 points(xdata, y2, col="red", pch="*")
 lines(xdata, y2, col="red",lty=2)

# Add Third curve to the same plot by calling points() and lines()
# Use symbol '+' for points.
 points(xdata, y3, col="dark red",pch="+")
 lines(xdata, y3, col="dark red", lty=3)

Adding legends to the multiple curves
Legends can be added to describe the different curves in the plot. For this, we call the
x, y -----> X and Y axis locations in the graph coordinates.

legend-----> A vector of string consisting of legends, typically one per graph

col -----> A vector of colors for 'col' parameter. These colors are same as the ones
             used in the graph

pch -----> A vector of character symbols for 'pch' parameter, same as the ones
             used as 'pch' parameters in the plots.

lty -----> A vector of line types to be given to 'lty' parameter, same as the one
             used for plotting curved

ncol -----> Number of columns for writing the legends. Default is one column.

 For other parameters, type  help()   in R prompt.


While typing the vectors for  legend,  col and  pch,  the order of the  plot types
 have to be maintained.
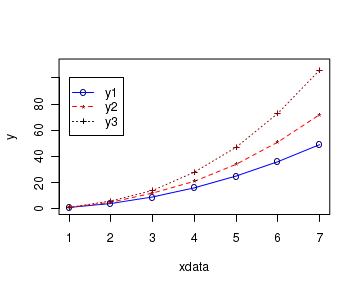
Carefully note the example code below which adds legend to the plot. The resulting figure has three curves with a legend box:
# define 3 data sets
xdata <- c(1,2,3,4,5,6,7)
y1 <- c(1,4,9,16,25,36,49)
y2 <- c(1, 5, 12, 21, 34, 51, 72)
y3 <- c(1, 6, 14, 28, 47, 73, 106 )

# plot the first curve by calling plot() function
# First curve is plotted
plot(xdata, y1, type="o", col="blue", pch="o", lty=1, ylim=c(0,110), ylab="y" )

# Add second curve to the same plot by calling points() and lines()
# Use symbol '*' for points.
points(xdata, y2, col="red", pch="*")
lines(xdata, y2, col="red",lty=2)

# Add Third curve to the same plot by calling points() and lines()
# Use symbol '+' for points.
points(xdata, y3, col="dark red",pch="+")
lines(xdata, y3, col="dark red", lty=3)

# Adding a legend inside box at the location (2,40) in graph coordinates.
# Note that the order of plots are maintained in the vectors of attributes.
legend(1,100,legend=c("y1","y2","y3"), col=c("blue","red","black"),
                                   pch=c("o","*","+"),lty=c(1,2,3), ncol=1)