CountBio
Mathematical tools for natural sciences
Biostatistics with R
Contour plots
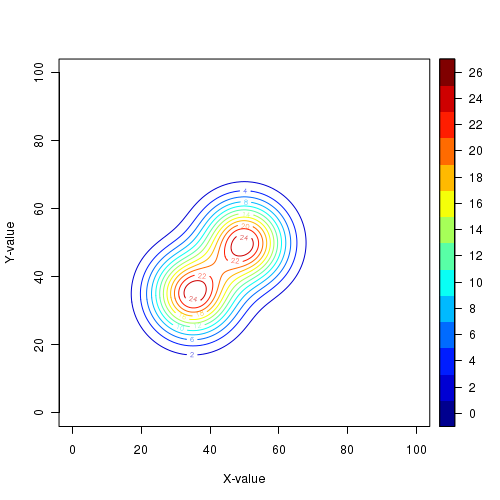
Contour plot is another way of displaying the 3D data. The data consists of z values on a (x,y) grid, similar to the 3D surface plot. The points on (X,Y) plane with close values are joint together by contours.
The library plot3D has a function called
The
library(plot3D)

## Gaussian across X  and Y
##  2D Gaussian Kernal
x = seq(0,100,0.2)
y = seq(0,100,0.2)

## We generate 2 Gaussian kernals and add them to create a double eyed structure.
z = matrix(data=NA, nrow=length(x), ncol=length(x))
z1 = matrix(data=NA, nrow=length(x), ncol=length(x))
z2 = matrix(data=NA, nrow=length(x), ncol=length(x))

sigma = 8.0
sigma1 = 8
sigma2 = 8
mux = 50.0
muy = 50.0
mux1 = 35.0
muy1 = 35.0
A = 10000.0
A1 = 1.0

for(i in 1:length(x))
{
  for(j in 1:length(y))
  {
    z1[i,j] =  A * (1/(2*pi*sigma1*sigma2)) * exp( -((x[i]-mux1)^2 + (y[j]-muy1)^2)/(2*sigma1*sigma2) )

    z2[i,j] =  A * (1/(2*pi*sigma^2)) * exp( -((x[i]-mux)^2 + (y[j]-muy)^2)/(2*sigma^2) )

    z[i,j] = z1[i,j] + z2[i,j]
  }
}


## plot contour using contour2D() function of plot3D libraty
contour2D(z,x,y, xlab="X-value", ylab="Y-value")
The resulting surface plots are shown below:
