CountBio
Mathematical tools for natural sciences
Biostatistics with R
Plotting Images
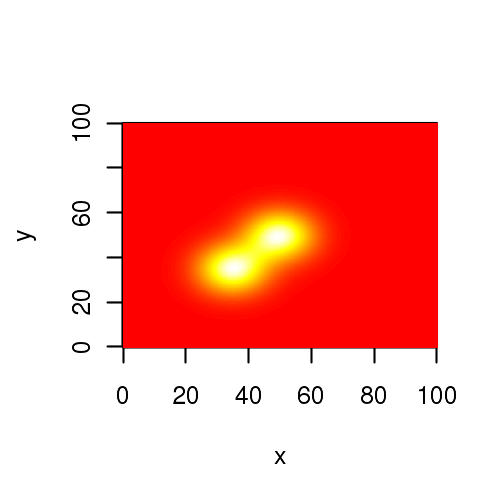
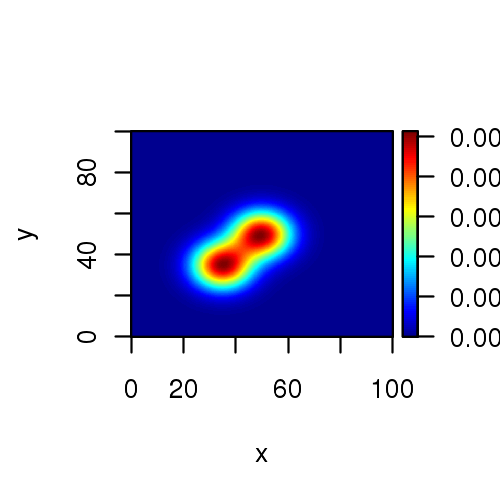
An image displays the variation of a quantity across the (X,Y) plane. The values of z variable across (x,y) grid is displayed as grey-scale rectangles with colours proportional to to the z value in the grid.
We will demonstrate images using two of many functions available in R. We will draw images using the function
For more details of these functions, type
The code below generates the image data in (X,Y) plane using 3D Gaussian quardrature formula. This is done just to generate an impressive image as a demonstration. We just have to substitute the x,y vectora and the Z matrix from our data to get the required image.
See the code and the resulting images given below:
## Creating images in R ##########################################


### We first create a Gaussian quardrature data.
## Gaussian across X  and Y
##  2D Gaussian Kernal
x = seq(0,100,0.2)
y = seq(0,100,0.2)
z = matrix(data=NA, nrow=length(x), ncol=length(x))
z1 = matrix(data=NA, nrow=length(x), ncol=length(x))
z2 = matrix(data=NA, nrow=length(x), ncol=length(x))

sigma = 8.0
sigma1 = 8
sigma2 = 8
mux = 50.0
muy = 50.0
mux1 = 35.0
muy1 = 35.0
A = 1.0
A1 = 1.0

for(i in 1:length(x))
{
  for(j in 1:length(y))
  {
    z1[i,j] =  A * (1/(2*pi*sigma1*sigma2)) * exp( -((x[i]-mux1)^2 + (y[j]-muy1)^2)/(2*sigma1*sigma2) )

    z2[i,j] =  A * (1/(2*pi*sigma^2)) * exp( -((x[i]-mux)^2 + (y[j]-muy)^2)/(2*sigma^2) )

    z[i,j] = z1[i,j] + z2[i,j]
  }
}


#### NOTE :  At this point, instead of x,y,z generated above, we can use any data.


# We call image() function of Graphics library to plot (x,y,z) generated above
image(x,y,z, col=heat.colors(60))

## Try these 2 options for 'col' parameter to get pretty plots!
# image(x,y,z, col=terrain.colors(60))
# image(x,y,z, col=topo.colors(60))


###-----------------------------------------------------------------------------
X11()

## We now call image2D() function from library plot3D.

## note **** : coordinates are given in the order z,x,y for this function.

image2D(z,x,y)
The resulting image plots are shown below: