CountBio
Mathematical tools for natural sciences
Basic Statistics with R
Hypothesis testing a population variance
This method can be used to test if the varince of a population is equal to a particular value. It is assumed that the data points are drawn randomly from a normal distribution.
The sample variance is computed from the n data points using,
$$ \small{ s^2 = \dfrac{1}{n-1}\sum_{i=1}^n (X_i - \overline{X})^2 } $$
From the properties of the Chi-square distribution, we know that the quantity \(\small{\dfrac{(n-1)s^2}{\sigma^2} }\) follows \(\small{\chi^2(n-1) }\), a Chi-square distribution with (n-1) degrees of freedom.
While studying about the distribution of a single population variance, we learnt that a \(\small{100(1-\alpha)\% }\) confidence interval for the population variance \(\small{\sigma^2 }\) is given by,
\(~~~~~~~~~~~~\small{\left[\dfrac{n-1}{b}s^2,~\dfrac{(n-1)}{a}s^2 \right]}\)
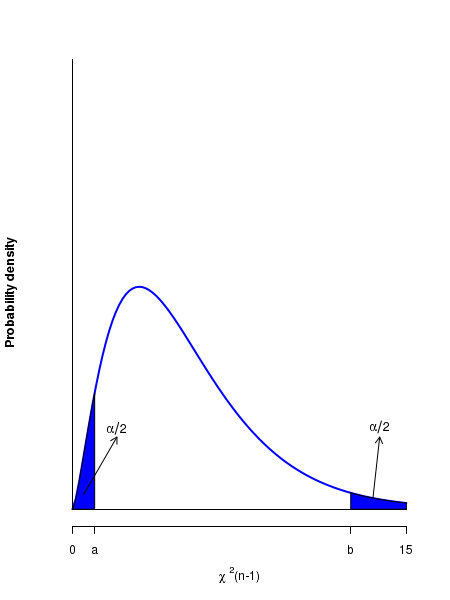
where the two points \(\small{a}\) and \(\small{b }\) are chosen on a Chi-square distribution with (n-1) degrees of freedom such that the area under the curve(probability) between these two points is \(\small{1-\alpha}\).
This means,\(~~\small{b = \chi^2_{1-\alpha/2}(n-1) }~~\) and \(~~\small{a = \chi^2_{\alpha/2}(n-1)~~ }\)
(ie., the area from 0 to \(\small{b}\) is \(\small{1-\alpha/2 }\) and the area from 0 to \(\small{a}\) is \(\small{\alpha/2 }\). The area in the two tail regions are equal to \(\small{\alpha/2 }\). Thus the area under \(\small{\chi^2(n-1)}\) curve between points \(\small{a}\) and \(\small{b}\) is \(\small{1-\alpha }~~\). See the figure below
With the above results, we can device a hypothesis test for a single population varince: Using the sample variance \(\small{s^2 }\) estimated from the data, compute the chi-square test statistics for a test value \(\small{\sigma=\sigma_0 }\) to be, \(\small{~~\chi^2~=~\dfrac{(n-1)s^2}{\sigma_0^2} }\) The two sided and one sided tests for their corresponding null ($H_0$) and alternate ($H_A$) hypothesis are devised as follows: 1. Two sided hypothesis \(\small{~~~~~~H_0~:~\sigma^2 = \sigma_0^2 }\) \(\small{~~~~~~H_A~:~\sigma^2 \neq \sigma_0^2 }\) Reject the null hypothesis $H_0$ if the computed statistic \(\small{\chi^2 \lt \chi^2_{\alpha/2}(n-1) }\) or \(\small{\chi^2 \gt \chi^2_{1-\alpha/2}(n-1) }\) For a two sided test, we can also reject null hypothesis if \(\small{\sigma_0^2 }\) is outside the \(\small{100(1-\alpha)\% }\) confidence interval \(~~\small{\left[\dfrac{n-1}{b}s^2,~\dfrac{(n-1)}{a}s^2 \right]}\) for the population standard deviation. 2. One sided hypothesis \(\small{~~~~~~H_0~:~\sigma^2 \leq \sigma_0^2 }\) \(\small{~~~~~~H_A~:~\sigma^2 \gt \sigma_0^2 }\) Reject the null hypothesis $H_0$ if the computed statistic \(\small{\chi^2 \gt \chi^2_{1-\alpha}(n-1) }\) 2. One sided hypothesis \(\small{~~~~~~H_0~:~\sigma^2 \geq \sigma_0^2 }\) \(\small{~~~~~~H_A~:~\sigma^2 \lt \sigma_0^2 }\) Reject the null hypothesis $H_0$ if the computed statistic \(\small{\chi^2 \lt \chi^2_{\alpha}(n-1) }\)
(a) For the two sided test, the critical values are calculated, using R function call qchisq(alpha/2, n-1) to be \(\small{b = \chi^2_{1-\alpha/2}(n-1) = \chi^2_{1-0.05/2}(25-1) = 39.36}\) \(\small{a = \chi^2_{\alpha/2}(n-1) = \chi^2_{0.05/2}(25-1) = 12.40}\) Since the test statistic value of 29.17 is withinthe range of [a,b], null hypothesis is not rejected. We therefore conclude that the population standard deviation \(\small{\sigma = 140 }\). (b) For the one sided test with \(\small{H_A : \sigma > 140 }\), we compute the critical value to be \(\small{\chi^2_c = \chi^2_{1-\alpha}(n-1) = \chi^2_{1-0.05}(25-1) = 36.41 }\) Since the test statistic value of 29.17 is not greater than the critical value 36.41, we fail to reject the null hypothesis \(\small{H_A : \sigma = 140 }\) against an alternative hypothesis \(\small{H_A : \sigma \gt 140 }\) to conclude that \(\small{\sigma \le 140 }\)
R-scripts
The R script below performs the one variable test on population variance.
##################################################
## Script for testing a single population variance.

## x is the data vector

## test_variance = value of population vaiance for testing

## alpha = significance level for the test

one_sample_variance_test = function(x, test_variance, alpha){

  ## compute the standard deviation and sample size from the data
  s = sd(x)
  n = length(x)

  ## compute chi-square test statistic
  test_statistic = (n-1)*s^2/test_variance

  ## Two sided test
  a =  qchisq(alpha/2, n-1)

  b =  qchisq(1-alpha/2, n-1)

  test_statistic = round(test_statistic, 2)
  a = round(a, 2)
  b = round(b,2)


  print("Two sided alternate hypothesis : population variance not equal to test value :")
  if( (test_statistic <= a) | (test_statistic >= b) ){
     print("Null hypothesis rejected,  alternative accepted")
     print(paste("chi-square test statistic = ", test_statistic, "  is outside the acceptance region [ ",a, ",", b," ]"))
  } else {
	    print("Null hypothesis accepted,  alternative rejected")
     print(paste("chi-square test statistic = ", test_statistic, "  is inside the acceptance region [ ",a, ",", b," ]"))
  }

  print("-----------------------------------------------------")


  ##  One sided test :  Alternate hypothesis : population variance > test_variance


   print("One sided alternate hypothesis : population variance > test value :")

  chisq_critical = qchisq(1-alpha,n-1)

  chisq_critical = round(chisq_critical, 2)

  if(test_statistic > chisq_critical){
     print("Null hypothesis rejected,  alternative accepted")
     print(paste("chi-square test statistic = ", test_statistic, "  is greater than the upper critical value ", chisq_critical))
  } else {
     print("Null hypothesis accepted,  alternative rejected ")
     print(paste("chi-square test statistic = ", test_statistic, "  is less than the upper critical value ",chisq_critical    ))

  }


  print("-----------------------------------------")

 ##  One sided test :  Alternate hypothesis : population variance < test_variance


   print("One sided alternate hypothesis : population variance < test value :")

  chisq_critical = qchisq(alpha,n-1)

  chisq_critical = round(chisq_critical, 2)

  if(test_statistic < chisq_critical){
     print("Null hypothesis rejected, alternative accepted")
     print(paste("chi-square test statistic = ", test_statistic, "  is less than the lower critical value ", chisq_critical))


  } else {
     print("Null hypothesis accepted,  alternative rejected")
     print(paste("chi-square test statistic = ", test_statistic, "  is greater than the lowercritical value ",chisq_critical))

  }


}


### Testing the function "one_sample_variance_test"

## this data set is randomly drawn from a Gaussian of mean=140, sd=20, var = 20^2 = 400
x = c(142.8, 135.0, 157.5, 148.4, 135.9, 153.4, 149.0, 130.2, 156.0, 189.7, 151.6, 156.5,
	  123.8, 152.9, 118.4, 145.8)

## we test whether the data set is drawn from Gaussian whose variance is 29^2 = 841 ##  nulll rejected
one_sample_variance_test(x, 841, 0.05)

## we test whether the data set is drawn from Gaussian whose variance is 20^2 = 400  ## null accepted

#one_sample_variance_test(x, 400, 0.05)


###############------------------------------------------------
Executing the above script in R prints the following results and figures of probability distribution on the screen:
[1] "Two sided alternate hypothesis : population variance not equal to test value :"
[1] "Null hypothesis rejected,  alternative accepted"
[1] "chi-square test statistic =  4.91   is outside the acceptance region [  6.26 , 27.49  ]"
[1] "-----------------------------------------------------"
[1] "One sided alternate hypothesis : population variance > test value :"
[1] "Null hypothesis accepted,  alternative rejected "
[1] "chi-square test statistic =  4.91   is less than the upper critical value  25"
[1] "-----------------------------------------"
[1] "One sided alternate hypothesis : population variance < test value :"
[1] "Null hypothesis rejected, alternative accepted"
[1] "chi-square test statistic =  4.91   is less than the lower critical value  7.26"